
Presented by Edward Marszal, President & CEO, Kenexis
HAZOP studies are a cornerstone of process safety management. But as the industry pushes PHA data further downstream — into LOPA, into bowtie diagrams — teams keep running into the same wall: the same hazard scenarios must be rebuilt, by hand, in a different structure every time.
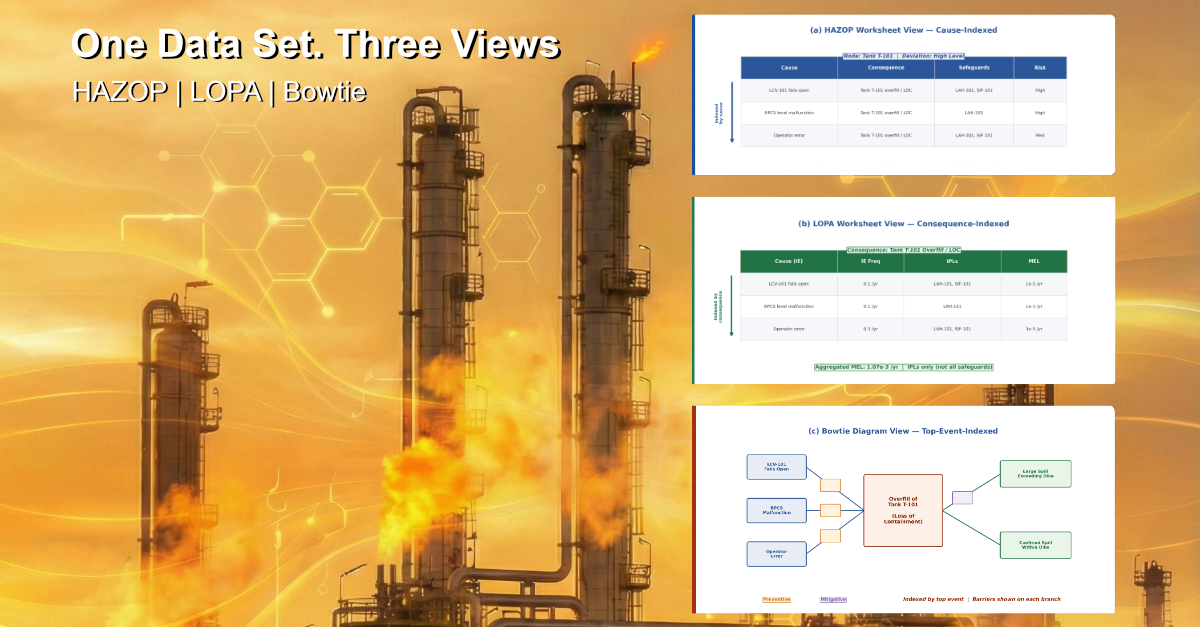
The obstacle is structural. HAZOP is cause-indexed. LOPA typically requires consequence-aggregation. Bowtie diagrams are organized around a top event. Three formats, three ways of slicing the same underlying reality — and no clean path between them.
The usual suggestion is to change how HAZOPs are run. After fifty years of proven practice, that isn’t a realistic option, and it isn’t necessary.
What we’ll cover
Ed Marszal will walk through a practical approach that leaves the facilitator’s workflow completely untouched, and instead layers new structure onto the cause-indexed HAZOP underneath it:
- An independent consequence table supporting many-to-many cause-consequence relationships
- A new hazards table representing bowtie top events
- Separation of safeguard equipment records from scenario-specific safeguard use cases
The result is a unified data structure in which a single data set can be rendered as a HAZOP worksheet, a LOPA worksheet, or a bowtie diagram — with an edit made in any view propagating automatically to all the others.
Bring your questions — we’ll take them as we go
This is a discussion, not a lecture. Ed will be answering questions throughout the session rather than saving them for the end, so if a point needs pushing on, push on it when it comes up. The room will include other process safety engineers, PHA facilitators, and risk analysts working the same problem — and if you’re skeptical this can be done without disrupting the study, that’s a conversation worth having live.