Fire and gas mapping, or fire and gas performance-based coverage design and analysis, solves the problem of where to put flammable gas, toxic gas, and fire detectors to identify a loss of containment hazard as soon as possible. We perform both geographical-based fire and scenario-based gas mapping based on the situation.
As the premier fire and gas performance-based mapping company, we use the principles of probability engineering defined in ISA TR84.00.07, Guidance on the Evaluation of Fire, Combustible Gas, and Toxic Gas System Effectiveness to determine the probability for loss of containment and the leak characteristics associated with major equipment items so we can access the risk appropriately and design a solution to provide the appropriate performance-based level of risk reduction for your situation. We have written books and training on the subject and work with the ISA on standards and teach the classes to increase awareness globally.
Our Fire and Gas Mapping engineering service follows the recommendations laid out in ISA-TR84.00.07
- Fire and Gas System Corporate Philosophy
- Performance Target Selection
- Detector Placement and Technology Assessment
- Detector Mapping (Coverage) Assessment
- Fire and Gas Functional Safety Assessment
- Fire and Gas Requirements Specifications Development
- Maintenance and Testing (Validation) Support
- Re-evaluation Assessment of Existing Systems
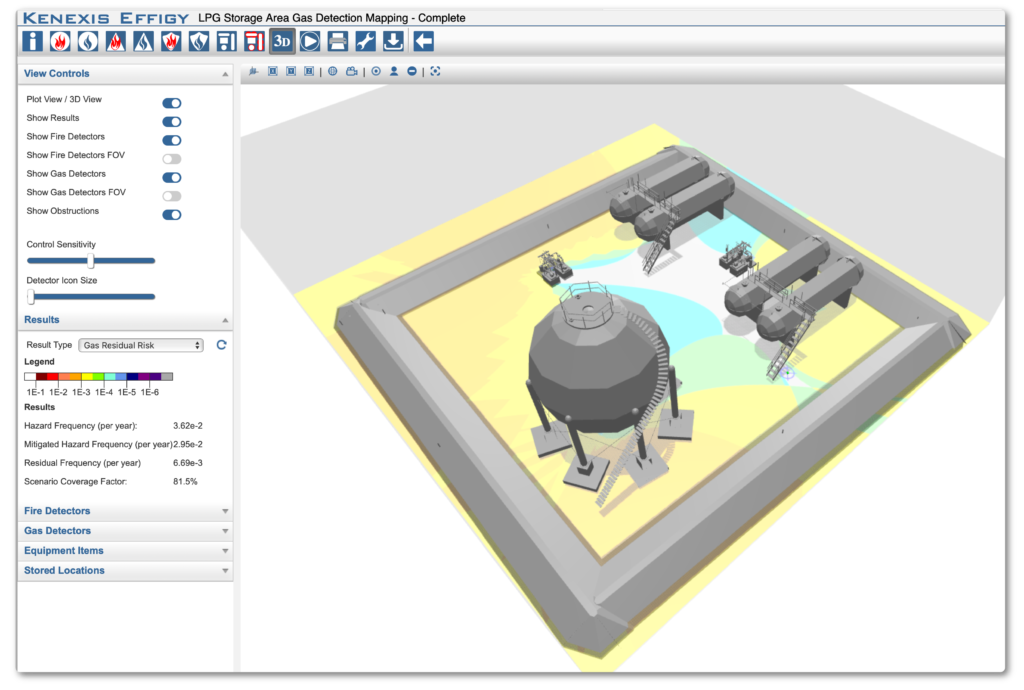
We use Effigy™ for all our fire and gas mapping analysis.
Scenario & Geographical Coverage
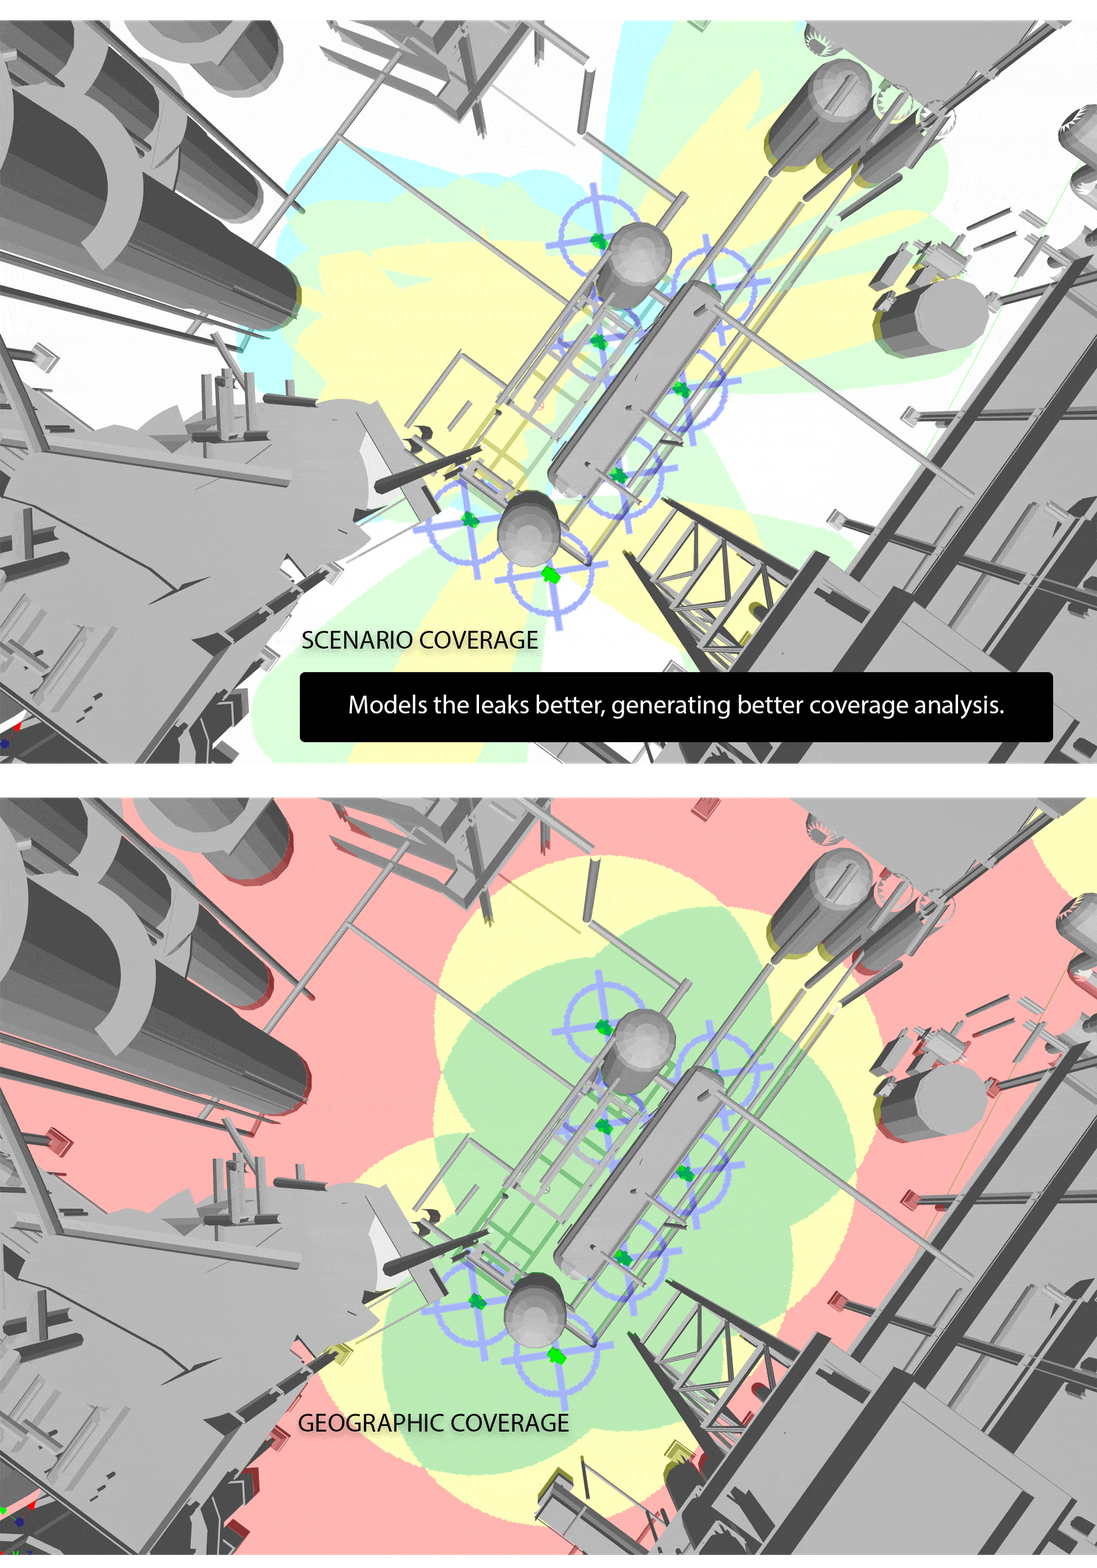
Our fire and gas mapping service, defined by the ISA TR84.00.07 recommendations, is performance-based your coverage targets are used by us to design a system using as few detectors as possible for toxic, flammable gas, and fire that will meet the performance target for each area of concern.
In Scenario Coverage, frequency for each scenario is determined and each piece of equipment has a model of the consequence created using gaussian or computation fluid dynamics.
In Geographical Coverage, we optimize the spacing of detectors based on equipment or areas of concern. Performance targets are applied to equipment or areas and detectors are placed to ensure the performance target is met by the detector layout design.
Peformance Targets

Performance targets are created using a semi-quantitative method defined in ISA TR84.00.07. Instead of spending days creating a QRA precise numbers for each piece of equipment, we use categories of equipment based on published failure rates from private and public reliable sources like the UK HSE. The process results in a performance target, also called grading. Grades are typically defined as A, B, or C, where grade A would include high pressure and highly flammable contents, grade B includes moderate pressure and flammability, and grade C is mostly at atmospheric temperature and pressure. Grades are determined by your risk criteria, and commonly come close to 90% coverage required for A, 80% for B, and 60% for C.
Qualified Engineers
Qualified engineers then assess where each detector location should be to maximize coverage and consider existing or planned equipment, power, structure, etc. The design processes periodically will perform coverage analysis to test progress and perform “what if” type analysis. Finally, the final coverage assessment is performed to ensure that the performance target is achieved. The design result includes the coverage analysis achieved and the exact location, type, rotation, inclination, and setting.
Our services are designed to provide the most rigorous analysis against performance targets, which results in the optimal coverage at the best cost for the service. Optimizing coverage, reduces detector numbers while still providing verified coverage and resulting in reduced installation cost and maintenance cost over lifetime.

In the image above, you will notice that there comes a point where additional detectors perform significantly less of the work. Knowing where that line is and understanding the process under control, make a significant difference in the analysis provided.
Optimizing Detector Placement
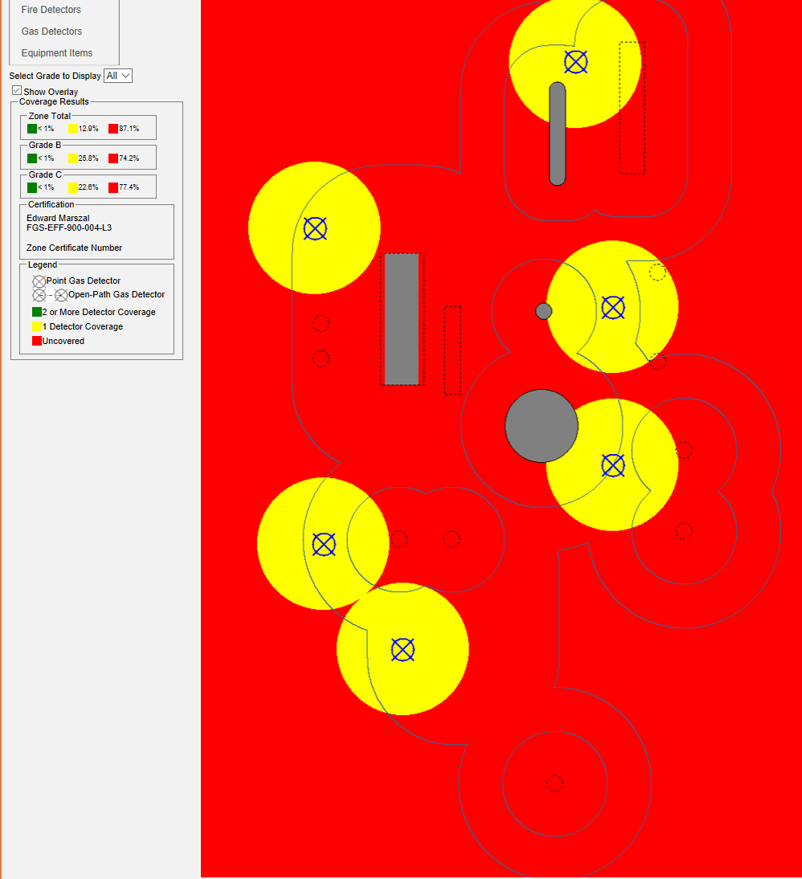
Image above shows the geographical location of gas detectors for a Scenario Coverage solution.
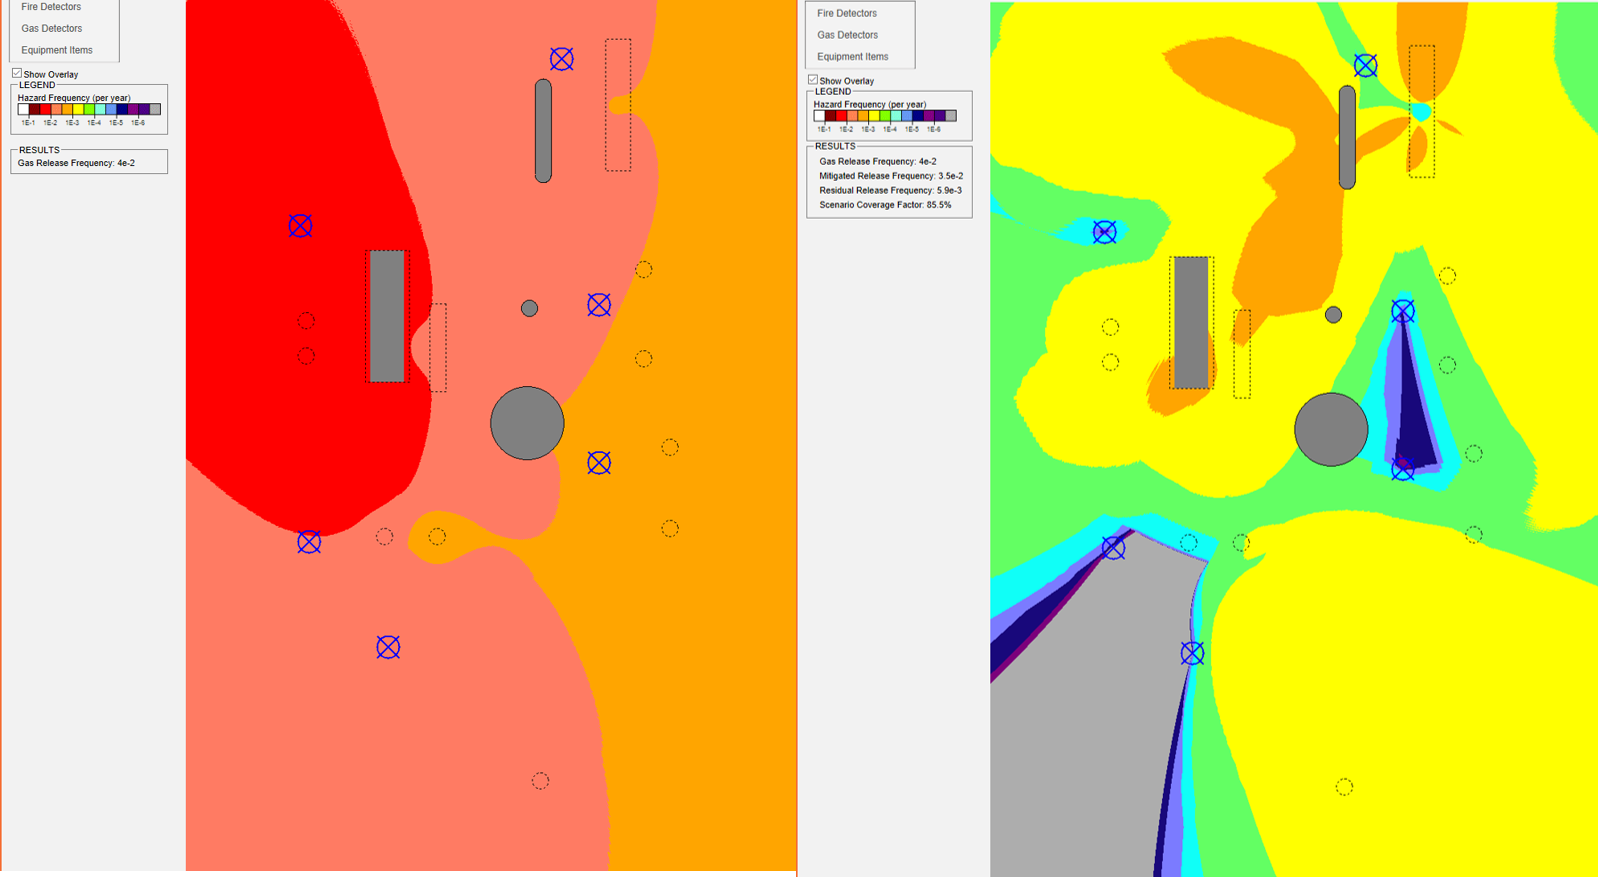
Picture above shows the unmitigated scenarios on the left and the mitigated result on the right for Scenario Coverage.
Hot colors represent greater risk and the cooler colors are reduced risk.
If you were the qualified engineer on this project, you would place your next detector in the orange area in the upper right to have the greatest risk reduction impact on this project.
During a recent project, we performed a brown field coverage assessment where detectors were already installed and operating. It was time to replace and possibly upgrade the detectors. We analyzed the existing coverage and made a few minor recommendations including the removal of 13 of the 27 detectors installed. The reduction in detectors resulted in a minor coverage reduction from 91% to 86% in a grade B area requiring 80% coverage. This eliminated the maintenance cost of 13 detectors that were only providing 5% of the total coverage.
While these results are very good, not every situation produces the same results. In fact, the quantity of detectors can increase to meet your performance targets. Regardless, you will know why every detector is necessary and at its location.
Continuing Engineering Support
Functional Safety Management Program maintenance is challenging. Our Continuing Engineering Support team provides a consulting engineer to assist your team as required. Our team of chemical engineers and functional safety experts are available for short or extended periods to function as part of an engineering team for something as simple as verifying SIL calculations or as complex as audits.
Functional Safety Assessment
Concerned about your first project?
Users our Fire & Gas Mapping Software – Effigy™, can take advantage of additional fire & gas mapping training at no cost.
Additionally, for a reasonable fee, our fire & gas mapping engineers will perform a functional safety assessment of your project.
The objective of the FGM-FSA (Fire & Gas Mapping – Functional Safety Assessment) is to determine if the scope of work was performed in compliance with the ISA 84.00.07 Technical Report.
For more information:
For General Inquiries and Software or Training Quotes please contact us by email at [email protected] or call +1-614-451-7031 or use the form below:
Contact - Kenexis
Use this form to contact Kenexis directly. We will respond as soon as possible, usually within one business day. Thank you.
"*" indicates required fields

