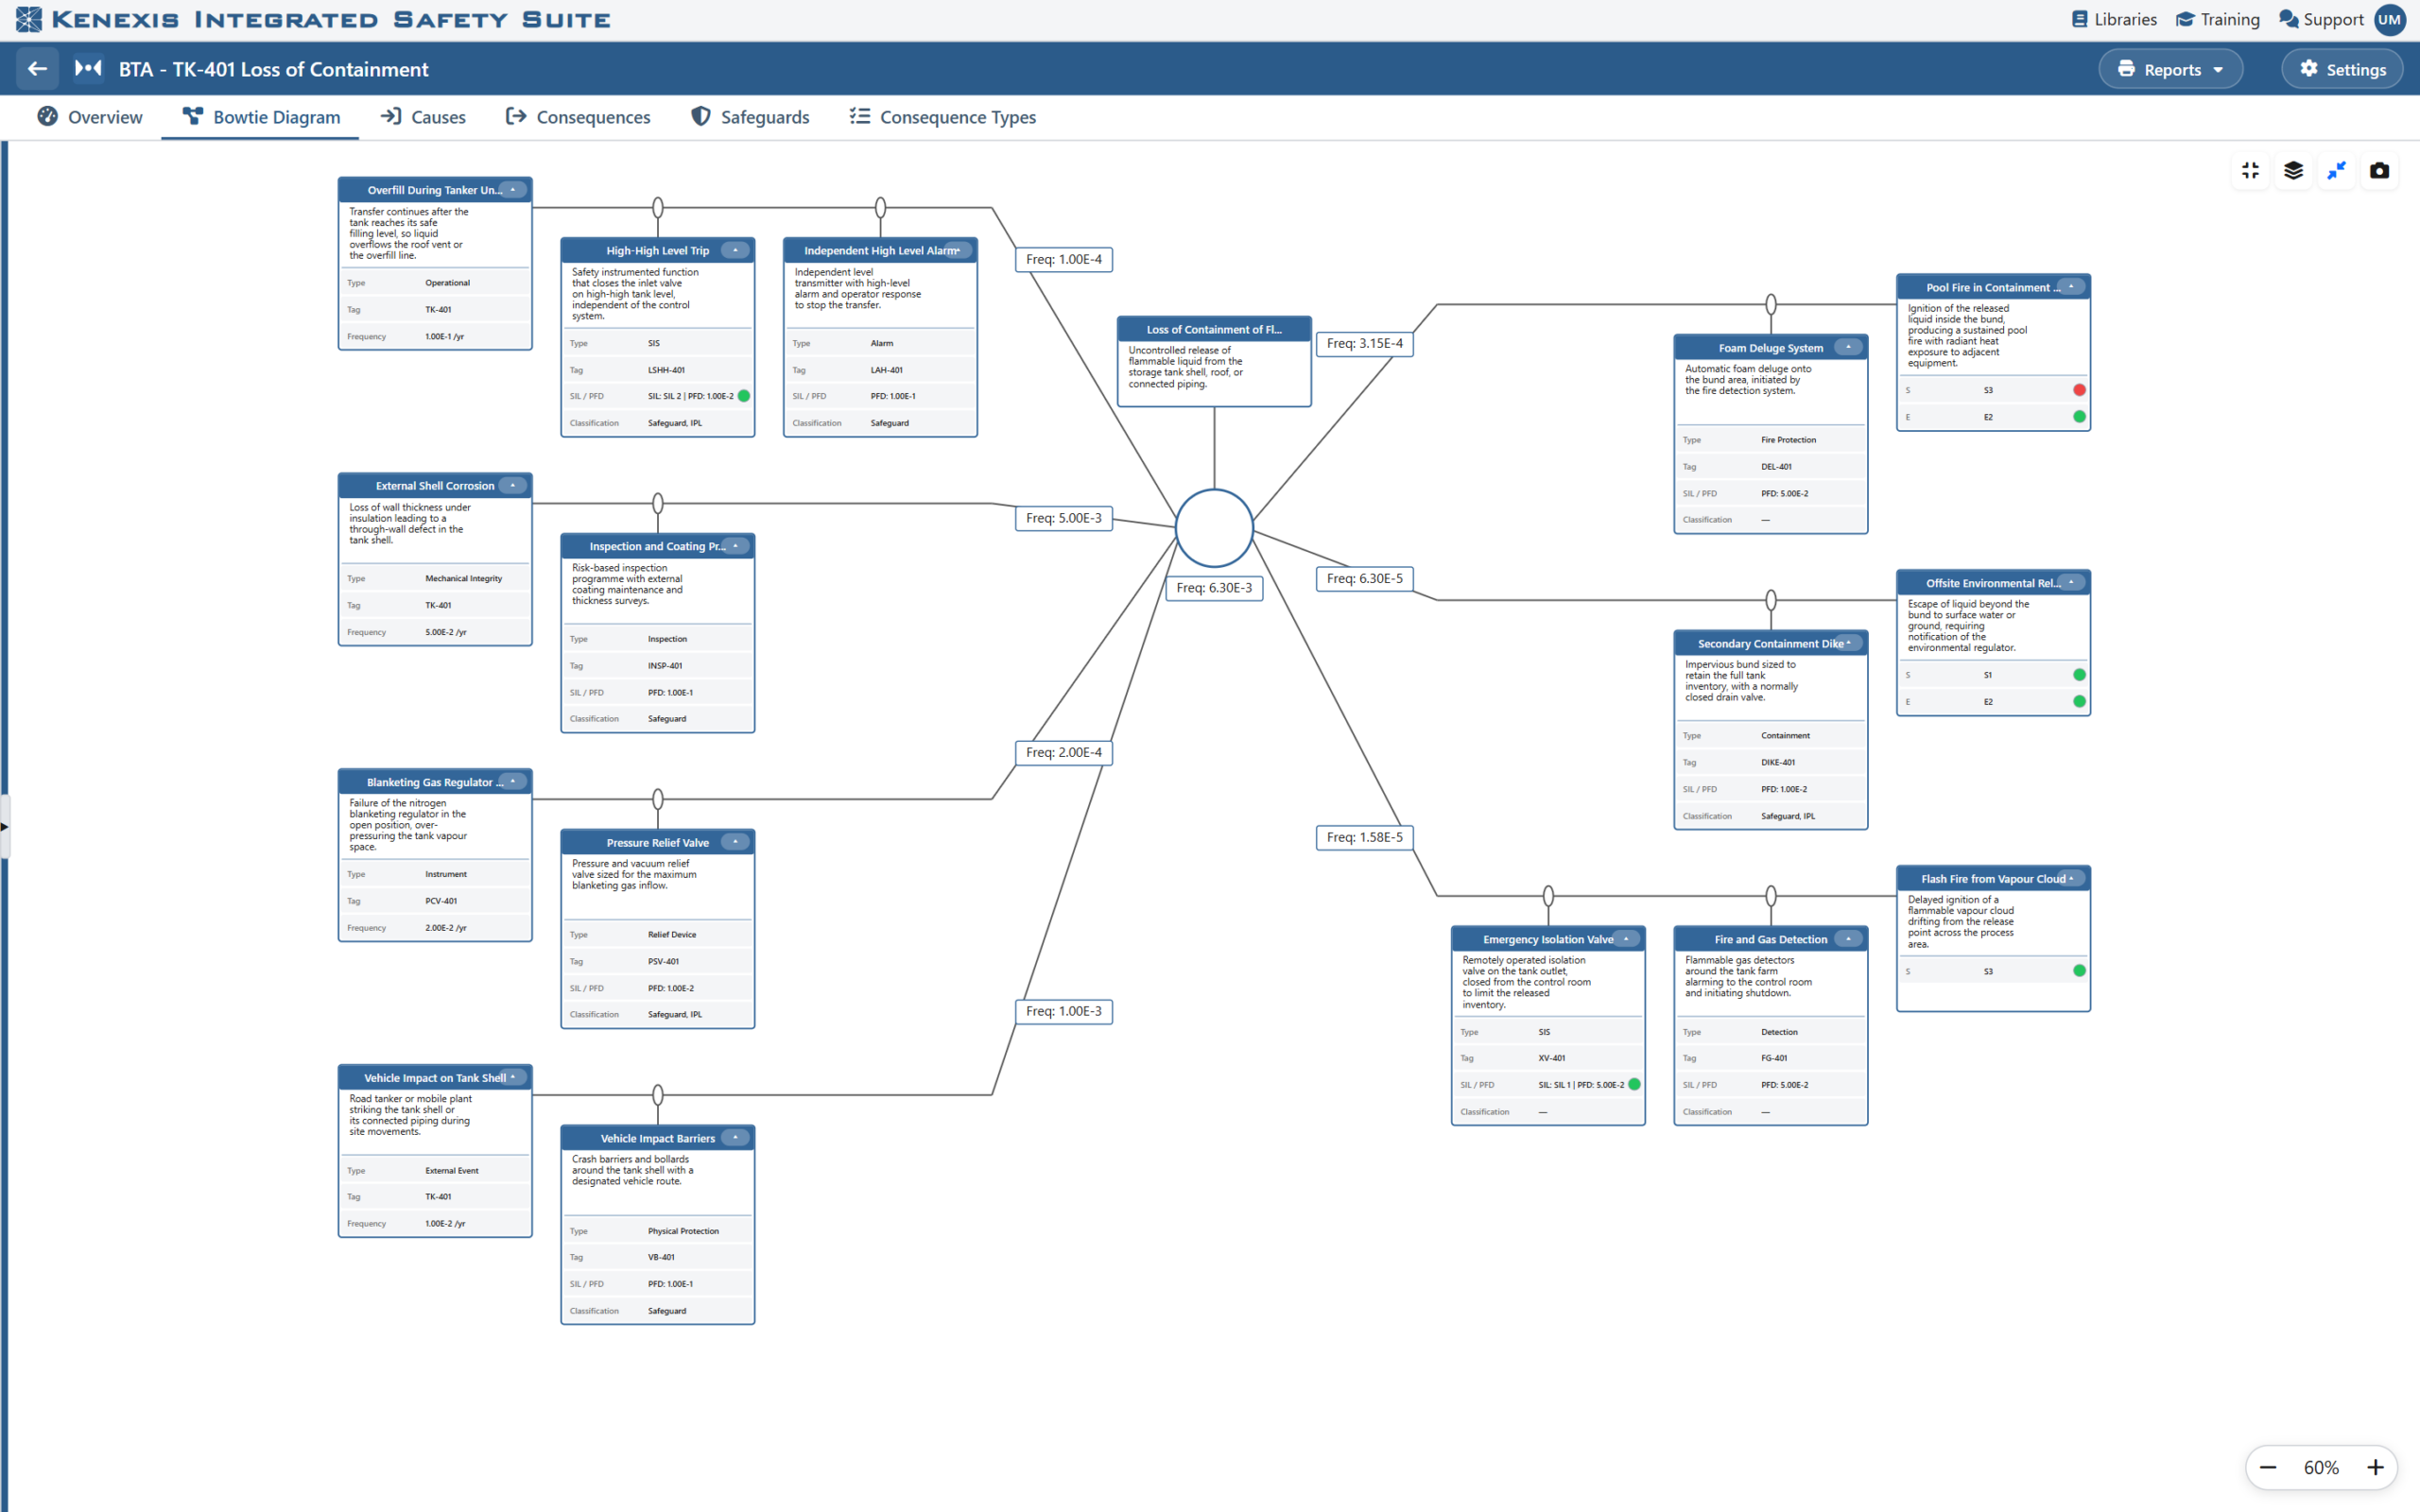
Figure 1. A quantitative bowtie in Kenexis® Bowtie. Frequency badges show each cause’s mitigated frequency, the top event frequency and each consequence frequency; the colored dots show each consequence category against its TMEL.

Figure 1. A quantitative bowtie in Kenexis® Bowtie. Frequency badges show each cause’s mitigated frequency, the top event frequency and each consequence frequency; the colored dots show each consequence category against its TMEL.