
Understand, Mitigate, and Master Your Industrial Risks
In the complex world of industrial facilities, ensuring safety and tolerability of risk isn’t just a goal, it’s a necessity. That’s where Kenexis® Bowtie comes in. As a powerful module within the Kenexis Integrated Safety Suite (KISS), Kenexis® Bowtie provides technical safety professionals with an intuitive, cloud-based, multi-user platform for comprehensive safety and risk analysis.
What is Kenexis® Bowtie?
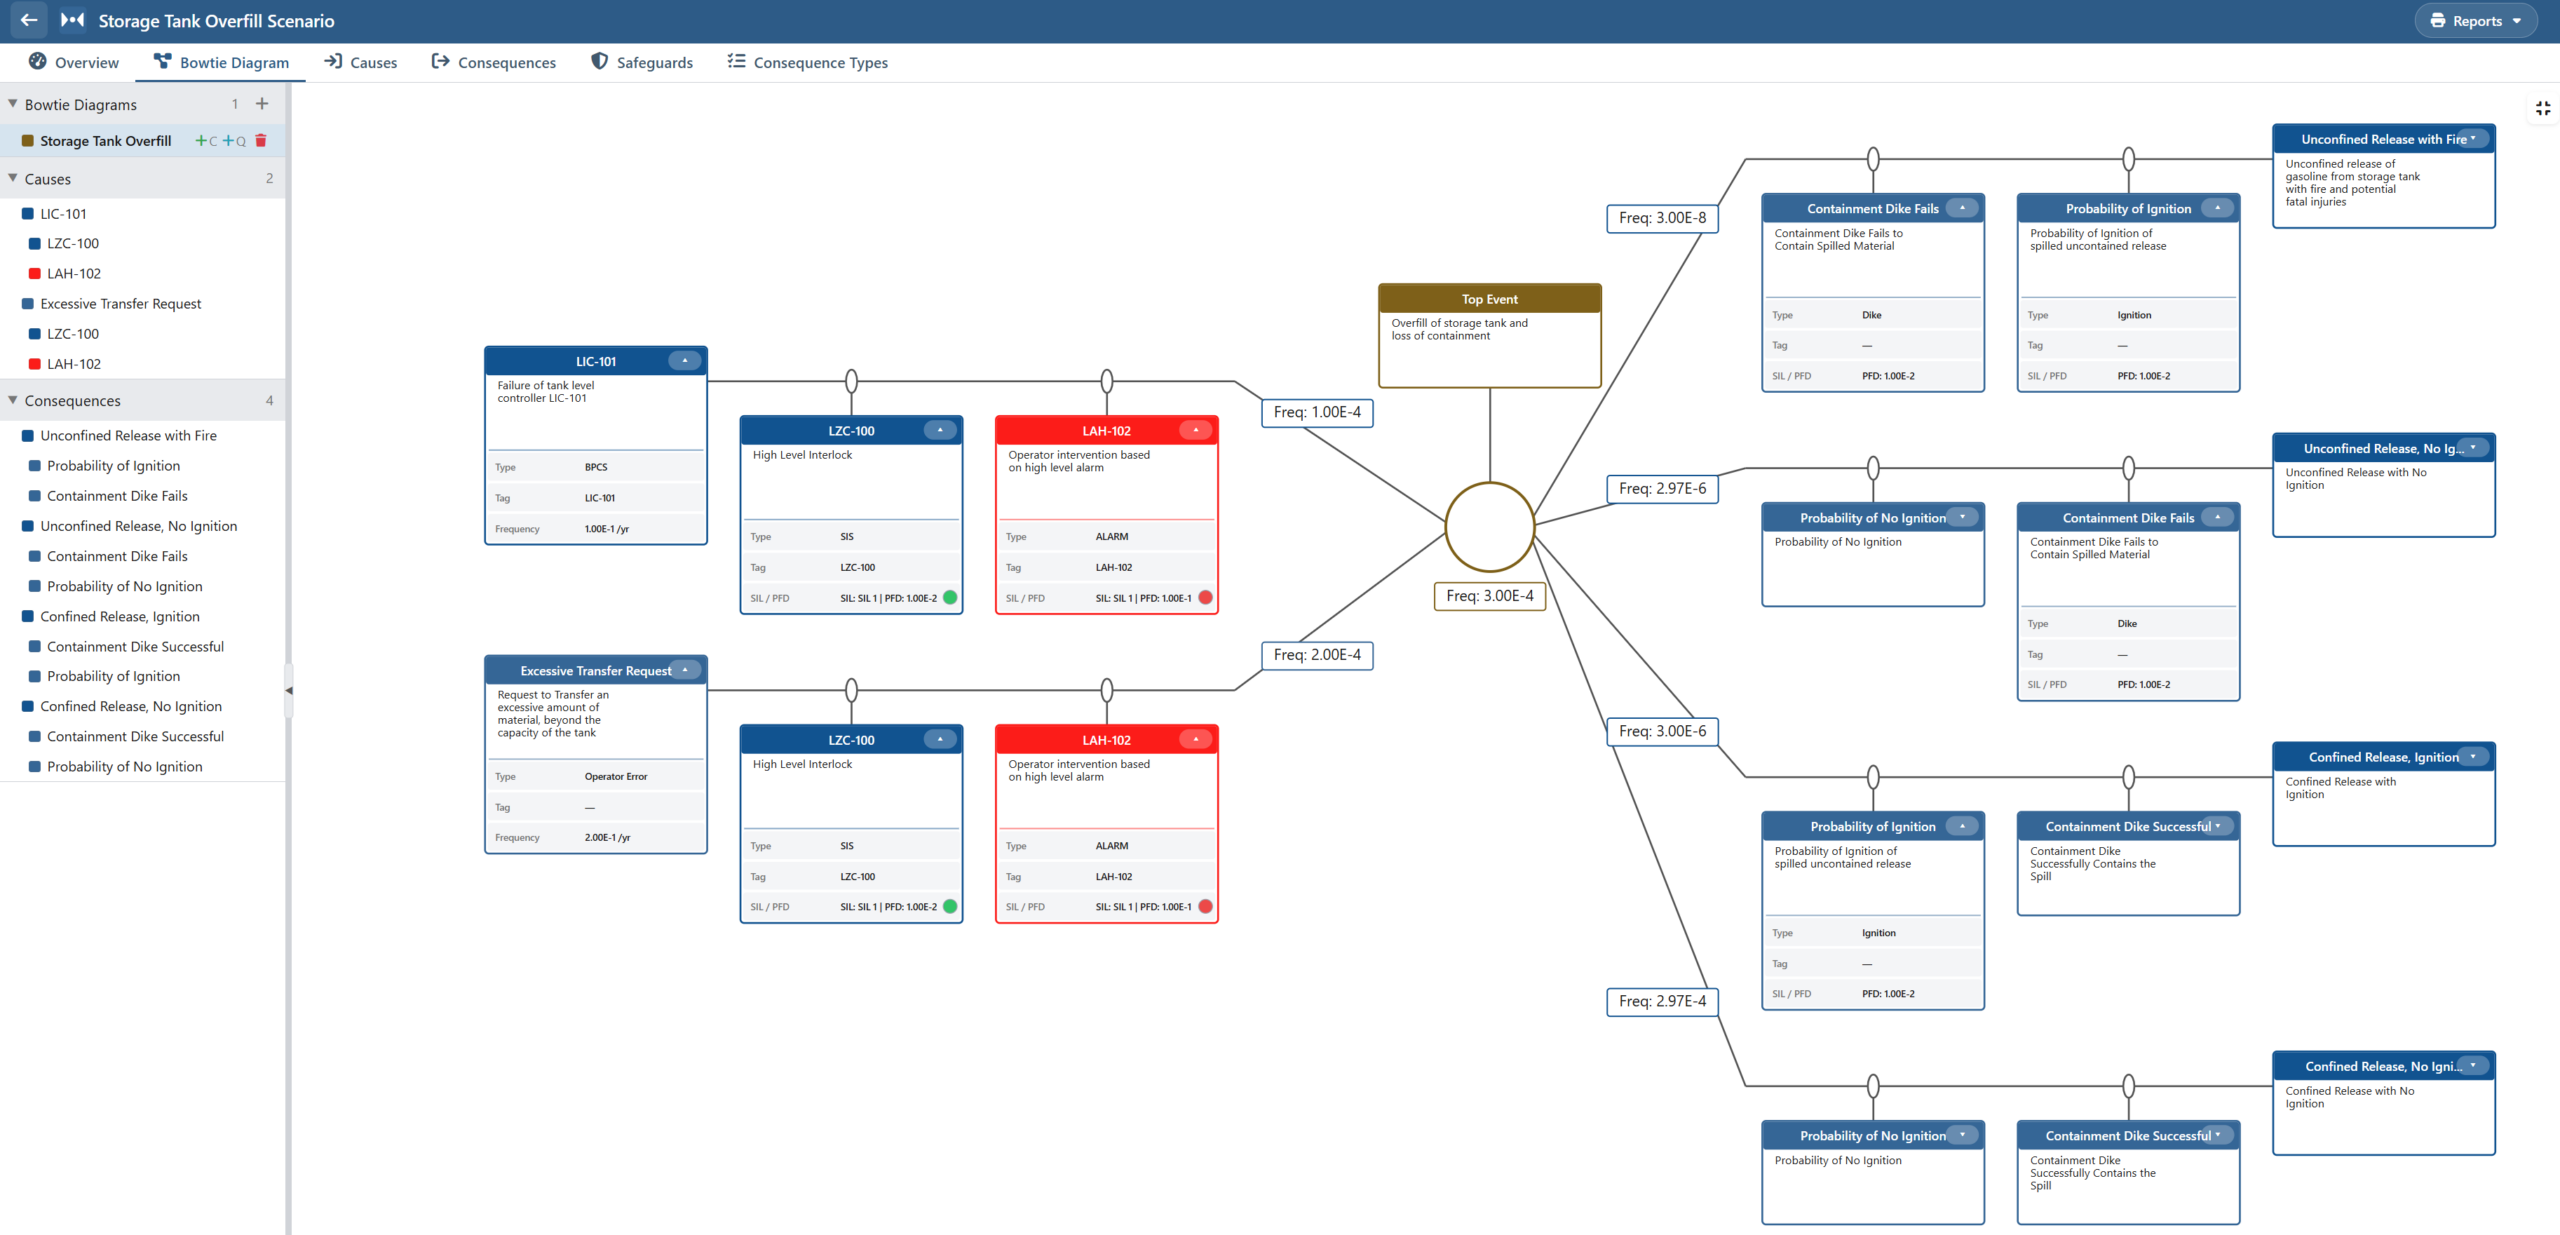
Kenexis® Bowtie leverages the widely recognized bowtie analysis methodology to help you visualize and quantify risk. It allows you to clearly map out causes (threats/initiating events), safeguards (preventative and mitigative barriers, including Independent Protection Layers – IPLs), top events, and consequences.
Most bowtie tools stop at the diagram — the picture that communicates major-accident risk to leadership and regulators. That diagram matters, but it doesn’t tell you whether the barriers are actually enough. Kenexis® Bowtie does the frequency math behind the picture: it calculates Mitigated Cause Frequency, Top Event Frequency, and Consequence Frequency and checks each against your Target Mitigated Event Likelihood (TMEL) criteria, so you can answer the question a board or regulator will ask — ‘and are those barriers sufficient?’ — with calculation, not assertion.
Shared barriers with LOPA
Build Your Barriers Once. The barriers and IPLs in Kenexis® Bowtie carry SIL, probability of failure, and LOPA-creditable status — the same objects used in LOPA (Kenexis® Open-PHA®), SIL verification (Kenexis® SIS – formerly Vertigo™), and complex frequency math (Kenexis® Fault Tree) on the same Kenexis Integrated Safety Suite platform. The IPL you credit in a bowtie is the IPL in your LOPA; the barrier that is a safety instrumented function is the SIF in your verification.
Why Choose Kenexis® Bowtie?
- Cloud-Based & Multi-User: Collaborate seamlessly with your team from anywhere, anytime. KISS provides an enterprise-level platform for all your technical safety and risk analysis activities.
- Comprehensive Risk Visualization: Clearly understand complex incident scenarios, identifying potential failure points and the effectiveness of your existing safeguards.
- Quantitative Insights: Go beyond qualitative assessments. Kenexis® Bowtie calculates critical frequencies, helping you make data-driven decisions about risk reduction measures and whether your Target Mitigated Event Likelihood (TMEL) criteria are met.
- Robust Documentation: Track revisions, add recommendations, and document personnel responses for a complete audit trail of your safety studies.
- Intuitive Interface: Designed for safety professionals, the Kenexis® Bowtie interface makes data entry and diagram construction straightforward.
- Integrated Quantitative Analysis: Shares barrier and IPL data with our Fault-tree Analysis Tool (Kenexis® Fault Tree) and SIS Lifecycle Management System (Kenexis® SIS -formerly Vertigo™) for a holistic, built once approach to risk assessment.
Key Features at a Glance
Study Management & Collaboration
- Study Dashboard: Get a high-level overview of your bowtie studies, including administrative information and a summary of results.
- Revisions Grid View: Track changes to your bowtie analysis model, documenting who made changes, when, and who checked and approved them.
- Recommendations Grid View: Document proposed changes to system designs based on your analysis, including priority, responsible party, and status.
Powerful Bowtie Diagramming
- Interactive Bowtie Interface: The central hub for building and visualizing your bowtie diagrams.
- Study Data Tree View: Easily navigate between different bowtie diagrams and their associated safeguards within a study.
- Flexible Workspace Controls: Add, edit, delete, and rearrange causes, safeguards, degradation factors, degradation controls, top events, and consequences with ease.
- Zoom & Export: Adjust the diagram zoom for optimal viewing and save your bowtie diagrams as high-quality image files (.png).
Detailed Data Entry & Analysis
- Detailed Forms: Input comprehensive information for each element of your bowtie diagram, including:
- Causes: Title, description, type, instrument tags, and frequency.
- Safeguards: Title, type, instrument tags, Safety Integrity Levels (SILs), probability of failure, and LOPA creditable status.
- Degradation Factors & Controls: Analyze factors that can degrade safeguard performance and implement controls to mitigate them.
- Consequences: Title, description, severity categories, and TMEL frequencies with clear indicators of compliance.
- Top Events: Define and manage the central hazardous event.
- Risk Criteria View: Define and manage associated risk matrices, likelihood categories, consequence categories, and risk rankings to standardize your numerical risk analysis.
- Quantitative Calculations: Automatically calculate:
- Mitigated Cause Frequency
- Top Event Frequency
- Consequence Frequency
- TMEL Criteria Compliance
Credentials
Kenexis® Bowtie is built by the authors of the methodology behind it: founder Ed Marszal is an ISA Fellow, co-developer of the LOPA method, and an ISA84 member since 1994 — and the LOPA credit rules that govern barrier sufficiency are the same authority behind the bowtie quantification.
Ready to Elevate Your Risk Analysis?
Join the many technical safety professionals who trust Kenexis for their risk management needs. Request a live demo or see below for a free 30-day trial and pricing information.
Pricing
A single concurrent-user license is $3,500 USD/year*.
*Prices shown apply to the United States, Canada and Europe. Prices in other regions may vary.
Visit our online store to buy now. If needed, please contact Kenexis for a proposal.