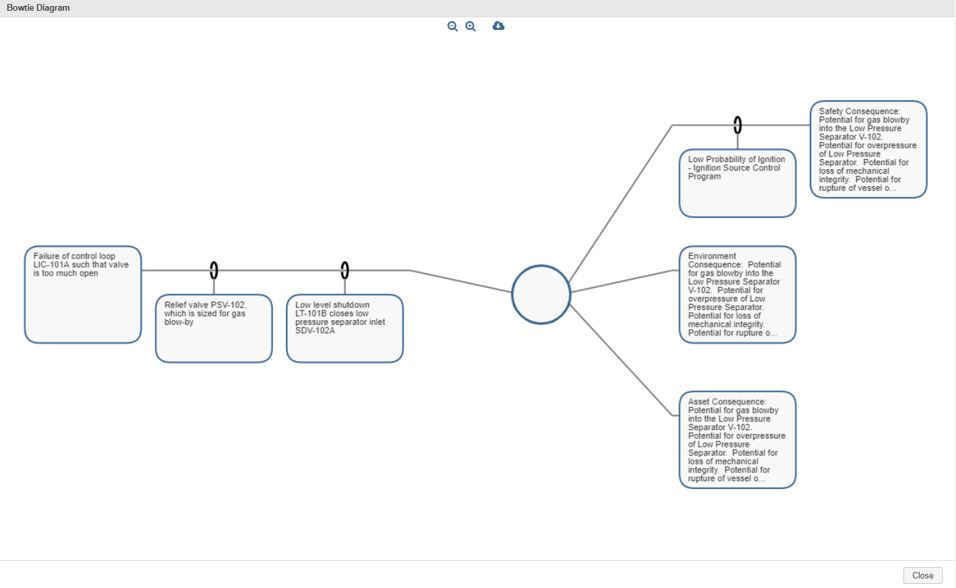
Bowtie Visualization for Open PHA
Kenexis is proud to announce a new premium feature in our best-in-class Open PHA HAZOP/LOPA facilitation and documentation software – Bowtie Visualization. Bow tie diagrams have become popular over the past decade as a method for visualization of hazard scenarios. In a bowtie diagram mulitple causes of a hazard are listed on the left, and are modified by “barriers” or safeguards the prevent the causes that prevent the cause from turning into the hazard. The central point, or the knot in the bowtie, is the hazard, which is generally a loss of containment scenario in the process industries. From the bowtie knot multiple different consequences are possible, each having barriers that mitigate the magnitude of the consequence.
Prior to Kenexis bowtie visualization separate studies and separate software were used to generate bowtie diagrams. This results in a lot of extra work with no value add along with confusing differences between studies. As part of our Unified Hazard Assessment™ (UHA™) initiative, Kenexis is working to allow a single software tool and a single study to serve all of the purposes of HAZOP, LOPA, Bowtie Visualization, and Hazard Registers. Providing a single source of the truth related to hazards analysis.
When in Open PHA, the user can select a LOPA scenario and then select “Bowtie Diagram” from the premium tools menu to automatically generate the bowtie graphic from the data contained in the LOPA study.
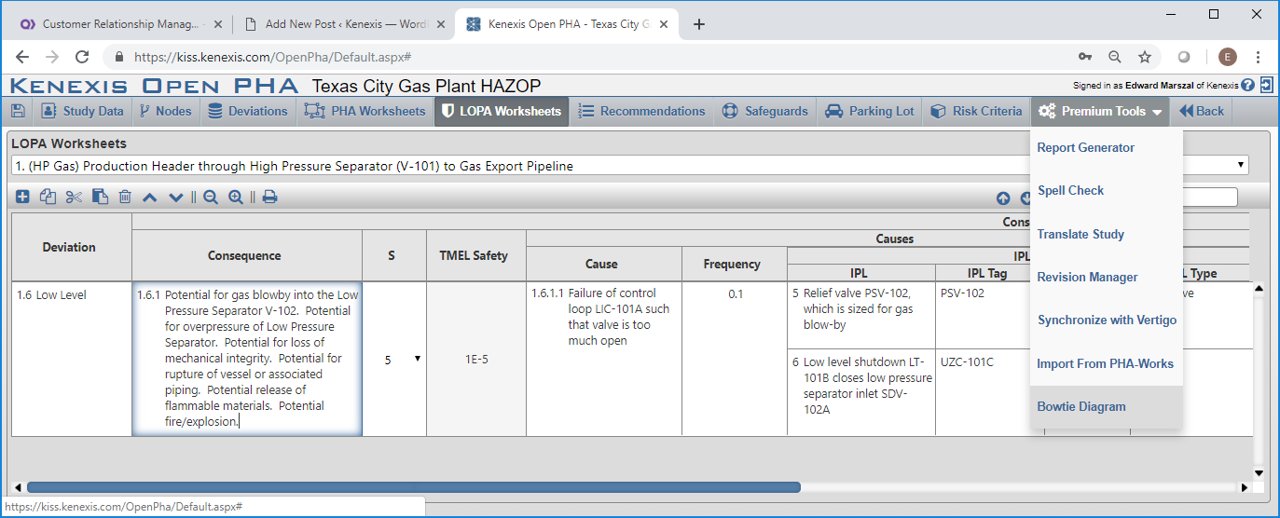
The figure shown above was generated from a consequence-indexed study (i.e., one consequence, multiple causes). For cause-indexed studies (i.e., one cause, multiple consequences), multiple causes can be shown in a single bowtie diagram by selecting the multiple causes before cliking on the bowtie visualization menu option. Either way, the bowtie diagram is automatically generated and availble for download into reports, as shown below.

This is just the beginning of Kenexis innovation in PHA. Kenexis has put together a roadmap of software features, training, and service options related to Unified PHA. The end goal is a unified approach, unified data structure, and best-in-class tools that will allow you to view and edit risk data in any way that a user or team needs all with the click of a button, but keeping a single unified data structure to allow corporate benchmarking, dashboard, comparison, and use of risk data for multiple tasks by multiple different teams and individuals within the organization.