There have been times when customers have asked whether or not our Effigy® fire and gas mapping software is capable of modeling in 2D instead of 3D. The rationale for the request is that the customer does not have 3D models for their facility, but would still like to have an analysis performed. All of the modeling that is done is always done in 3D, but 2D mapping can also be modeled, if required. When Kenexis does project work, we generally perform full 3D modeling even when our starting point is only a plot plan. Consider the following example plant which contains a diesel tank, butane bullet and four pumps (two for butane and two for diesel). The plot plan of the facility would look something like what is shown in the figure below, and is a typical of plot plans that we receive from customers for fire and gas mapping services.

If a 3D model were not provided as the starting point for a project, we would take the plot plans, like the one shown above, and enter it into Effigy® as an overlay, and then build the 3D model by measuring the locations of points that define the size and shape of the elements, and enter them into the database as geometric primitives. The locations of the points can be quickly identified in Effigy® through mouse pointer location tags, as shown in the following figure. With respect to measurements in the “z” dimension (e.g., height), we would rely on P&ID notes and equipment specifications. This data would then be entered into the database of equipment items, as shown below.

The result of adding all of the equipment items in would be the Primitives 3D model shown below.

Performing a fire detector mapping of a single detector in 3D at an analysis elevation of 1.5 feet (typical) might result in a map as follows (presented in 2D and 3D). Fire Detector located at <1,10,12> Declination 30 degrees, rotation 0 degrees, fire size of RHO=50 kW.

Even though results are presented in 2D in figure on right, the analysis is fully in 3D. If we wanted to perform a 2D analysis, for all of the equipment items, we could place their midpoint at grade (elevation = 0), and move the analysis plant to z=0. This would make the height dimensions irrelevant. Looking at the result in the 3D model viewer would result in the following figure.

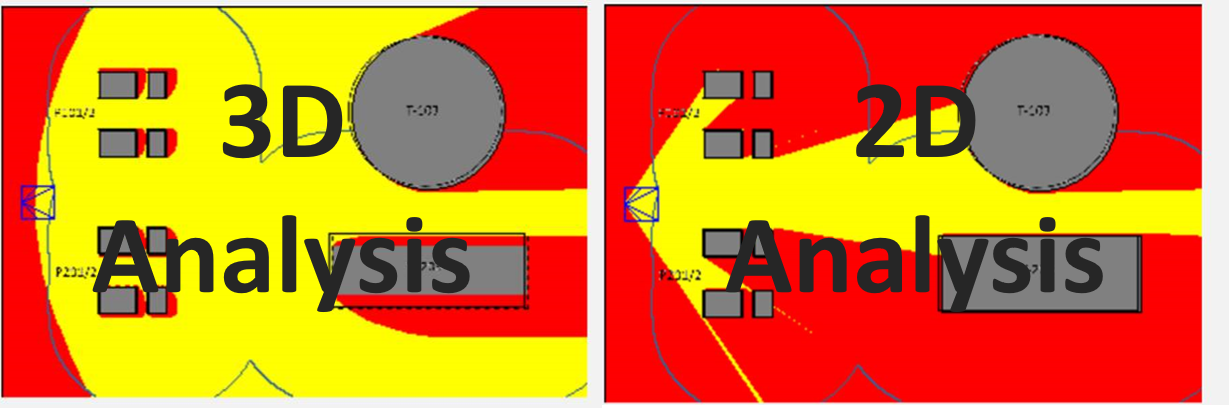
Also, you would need to change the fire detector’s elevation to z=0 and its declination angle to zero (i.e., pointing straight out). This would result in the following 2D mapping model (shown in 3D and 2D again, for comparison).

So, as you can see, a 2D analysis can be done in the software, but why would you want to? The difference in the amount of effort between a 2D analysis and a 3D analysis is not significant. Furthermore, the example above clearly demonstrates why a 3D analysis is so important and so valuable. Performing the analysis fully in 3D resulted in a coverage achievement of 70.2% while doing the same analysis in 2D results in only a 24.4% calculated coverage. The coverage calculated using 2D methods grossly underestimates the actual coverage achieved because the benefit of mounting a detector above equipment, and looking down is ignored. In any case, both 2D studies and 3D studies are possible. 3D studies are highly recommended because the additional engineering time required will be insignificant in comparison to the costs of the significant amount of additional detectors that will be required.