Most process plant engineering includes the development of 3D models that define the facility and help engineers to visualize the plant while it is still on the “drawing board”, allowing for optimization of design. These models are also a key part of determining the number of fire detectors that are required and where they should be placed. As the design develops, the amount of detail that is included in the model significantly increases.
As most engineers that are involved in the engineering, procurement, and construction (EPC) of process plants knows, there are several stages in the development of a facility. The first gate is often referred to as the 30% gate, nominally representing a 30% completion of the details of the 3D model. At this early stage, the 3D model generally only contains the detail of major equipment, and major large diameter piping systems. The design will then move to a 60% and 90% stage. In the later stages of the design process more detail is added in, including instruments, instrument tubing, wiring, and vessel appurtenances. Even at the 60% stage the drawings start to become very crowded, which can become a very big problem with respect to achieving fire detector coverage targets if the software that you use does not elegantly address the fact the small obstructions cannot block a fire detector’s view of a fire because a real fire has volume.
Early stage 3D models, like the ones the fire and gas mapping software vendors show in their advertisements and demos, generally show very little detail. Consider the 3D model of a LPG sphere shown below. It only contains the major equipment items and major piping systems. The level of detail is very low, which makes achieving coverage targets easy to do.

Real plants have much more detail than this. Even at the 60% completion point of a typical plant details of items like instrument stands and even valve stems and hand-wheels crowd drawings. Instead of the clean spacious drawings of the initial phases, crowded, equipment packed models are the reality, as shown in the figure below.

As you can see in the figure above, this drawing is packed with small diameter obstructions, but while a these obstructions exist, you will also note that they will not be able to completely block the view of a typical design basis fire (such as the common 1 ft diameter, 3 ft high plume). The most common fire detection coverage mapping techniques employ a point model or a ray tracing algorithm that considers the line of site from the detector to a point at the end of the detector’s cone-of-vision, and determine if the path is obstructed. These methodologies basically assume that the fire is an infinitely small source of the design basis amount of thermal radiation.
The reality is that fires have volume! The 1ft x 1ft pan fire used in FM 3260 testing has a height of about 3 ft. This volume of fire cannot hide behind an instrument tube, a wire, or a valve hand-wheel, but point models/ray tracing results indicate that it can. The patent pending Kenexis Plume Fire Modeling technique gives a fire volume, taking the design basis fire size radiation and distributing it out over the entire surface of the fire. Then, the radiation from all of the finite volume elements is individually analyzed to determine whether or not it is obstructed. The total received radiation flux at the detector is then summed up to determine if it exceeds the activation threshold.
Consider an offshore platform that was analyzed using both Point Modeling and Plume Modeling (Effigy from Kenexis™ can run the models both ways). This is the same crowded facility for which the 3D model above is displayed. As shown in the figure below, a Grade B coverage target of 80% and Grade C coverage target of 60% (in a 2ooN voting arrangement) was achieved by 12 fire detectors.

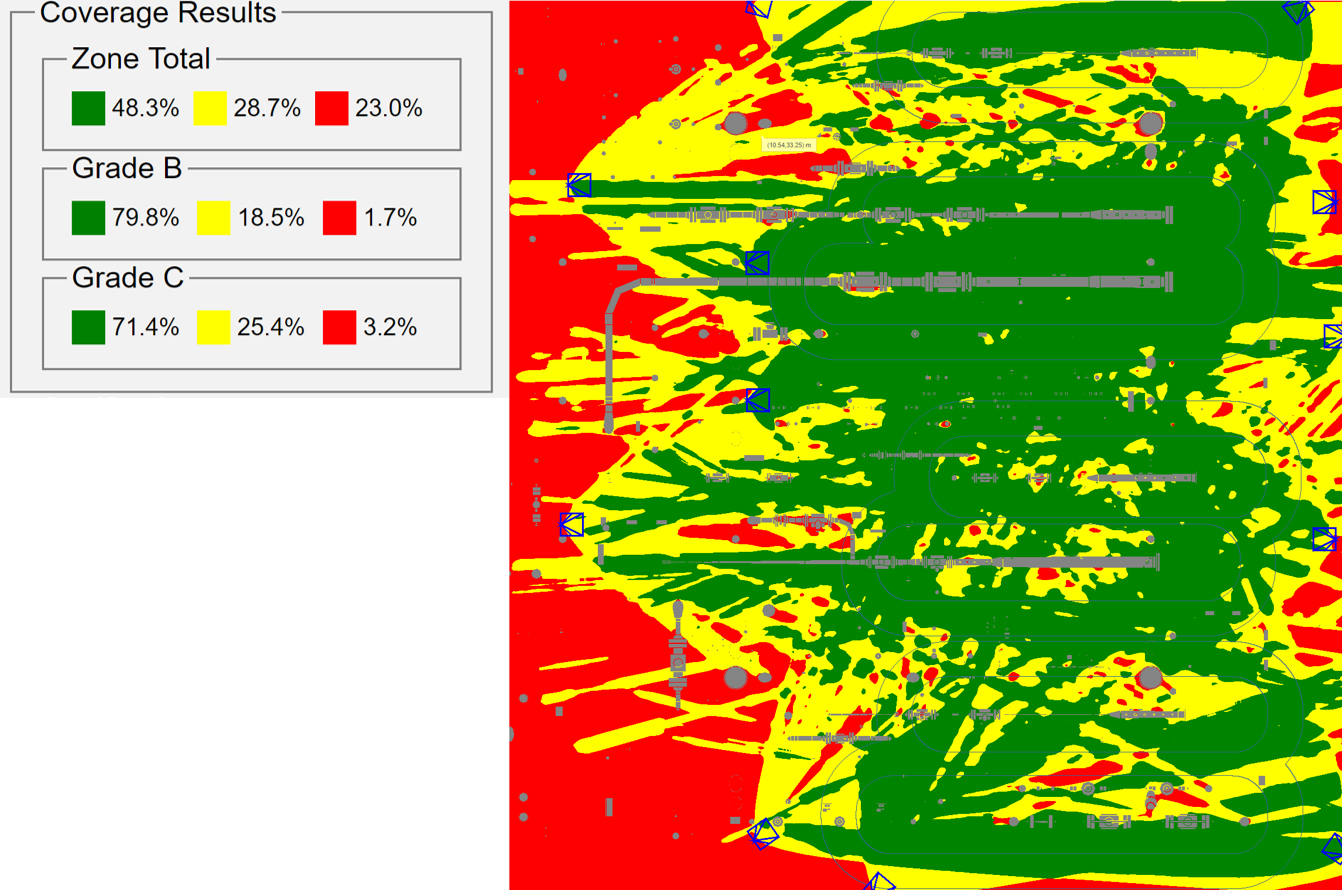
The only reason that this level of coverage was able to be accurately modeled was through use of the Kenexis plume fire model, if this same facility was analyzed using older point model/ray tracing techniques, the “apparent” coverage is significantly worse. The coverage that was achieved was only 46% for Grade B and 43% for Grade C, as shown in the figure below.

Looking at this figure, it is easy to see the inaccuracy in the modeling. Inside the coverage map you will see very long and thin shadows that are cast by small diameter obstructions, such as instrument tubing. The reality is that a fire cannot actually hide in these shadows due to its volume. As such, including those shadows in the coverage mapping is incorrect and leads to artificially low coverage calculations which will in turn result in artificially high detector counts required to achieve the stated coverage targets.

In order to return to the coverage to the target values, an additional 15 detectors were added to the design. The coverage map is shown below. As with the previous coverage map, one can see a lot of small diameter shadows that show the weakness of point model/ray tracing algorithms. For this example, which is a single deck of an offshore platform, the difference in detectors is 12 for plume fire modeling versus 28 detectors for point model/ray tracing. This difference is staggering! The inferior fire coverage modeling methods resulted in a 130% increase in the number of detectors that are required. MORE THAN DOUBLE! In terms of additional cost, if the cost of a typical fire detector, installed, is about $15,000, then on this platform deck alone, the point model/ray tracing method resulted in an additional $240,000 of fire detectors in capital costs alone. Adding the cost of testing and maintaining these additional detectors make the situation even more expensive. This example clearly demonstrates that fire detailed 3D models, use of the plume fire model for determining fire detector coverage is the only option that will result in reasonable detector designs.